Bringing design thinking to data visualization
CONTEXT
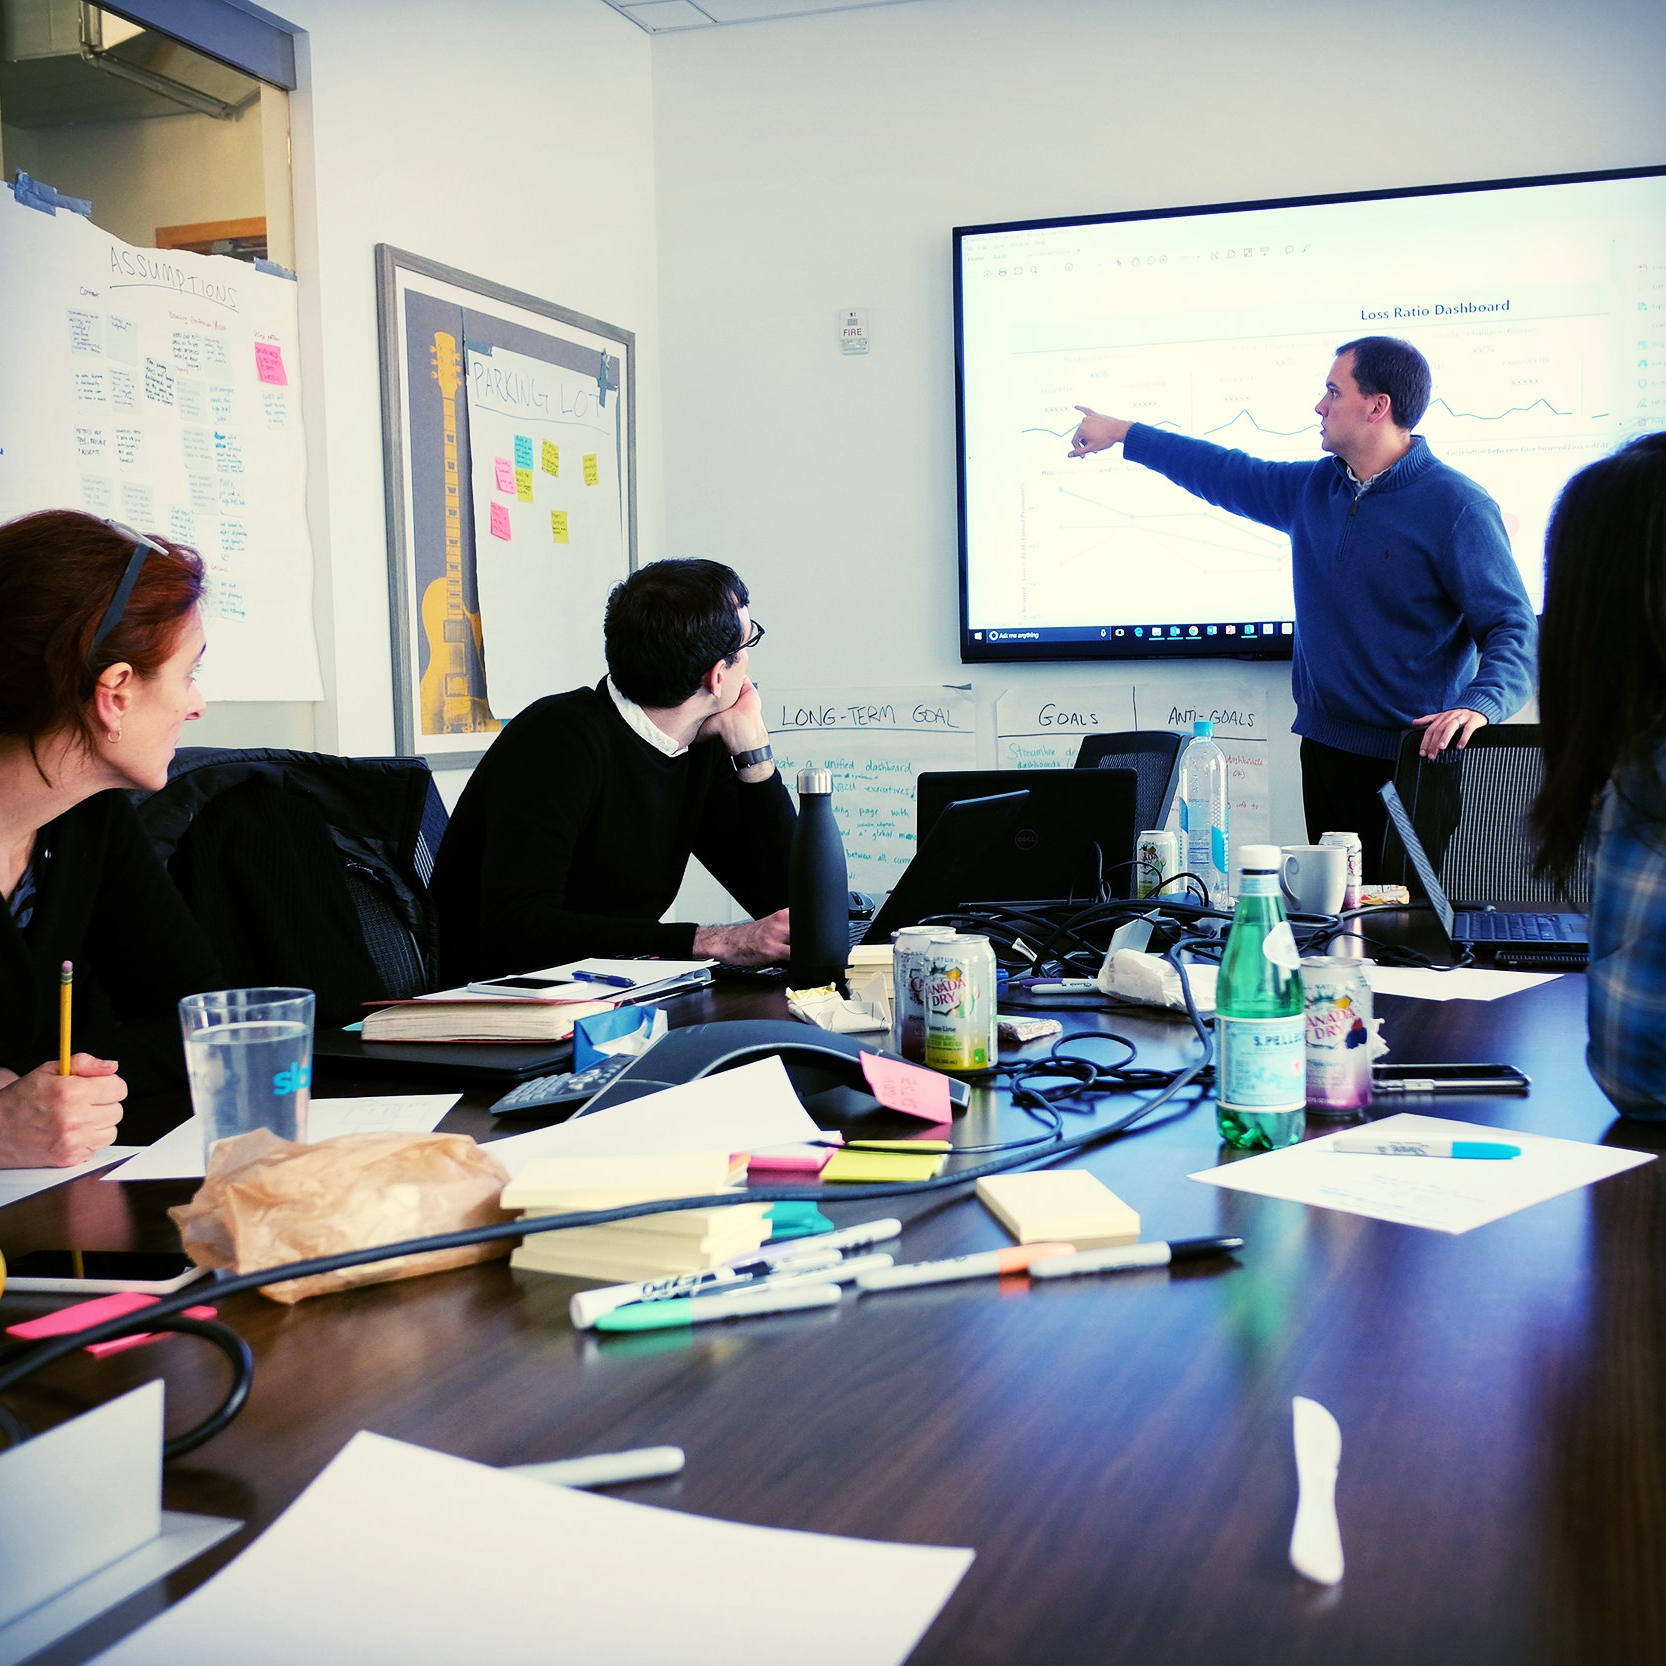
A large company had developed an internal product for the review and reporting of analytics by C-suite executives. However, the product included disparate sections which needed to be tied together through a centralized dashboard. Our data visualization team was already doing technical discovery work, and it made sense to join forces with them in a design sprint to effectively scope requirements. The sponsoring stakeholder was also interested in learning and applying design thinking exercises among her own team members, so turning activities into tutorials was a secondary objective of the sprint.
Challenge
While Slalom's data visualization team was already committed to a design and build phase, we needed address the user experience before moving forward. A design sprint was the fastest way to do this. Because of their high profile, we did not have access to our target users – so we had to rely on existing research, insider knowledge, and best practices.
Approach
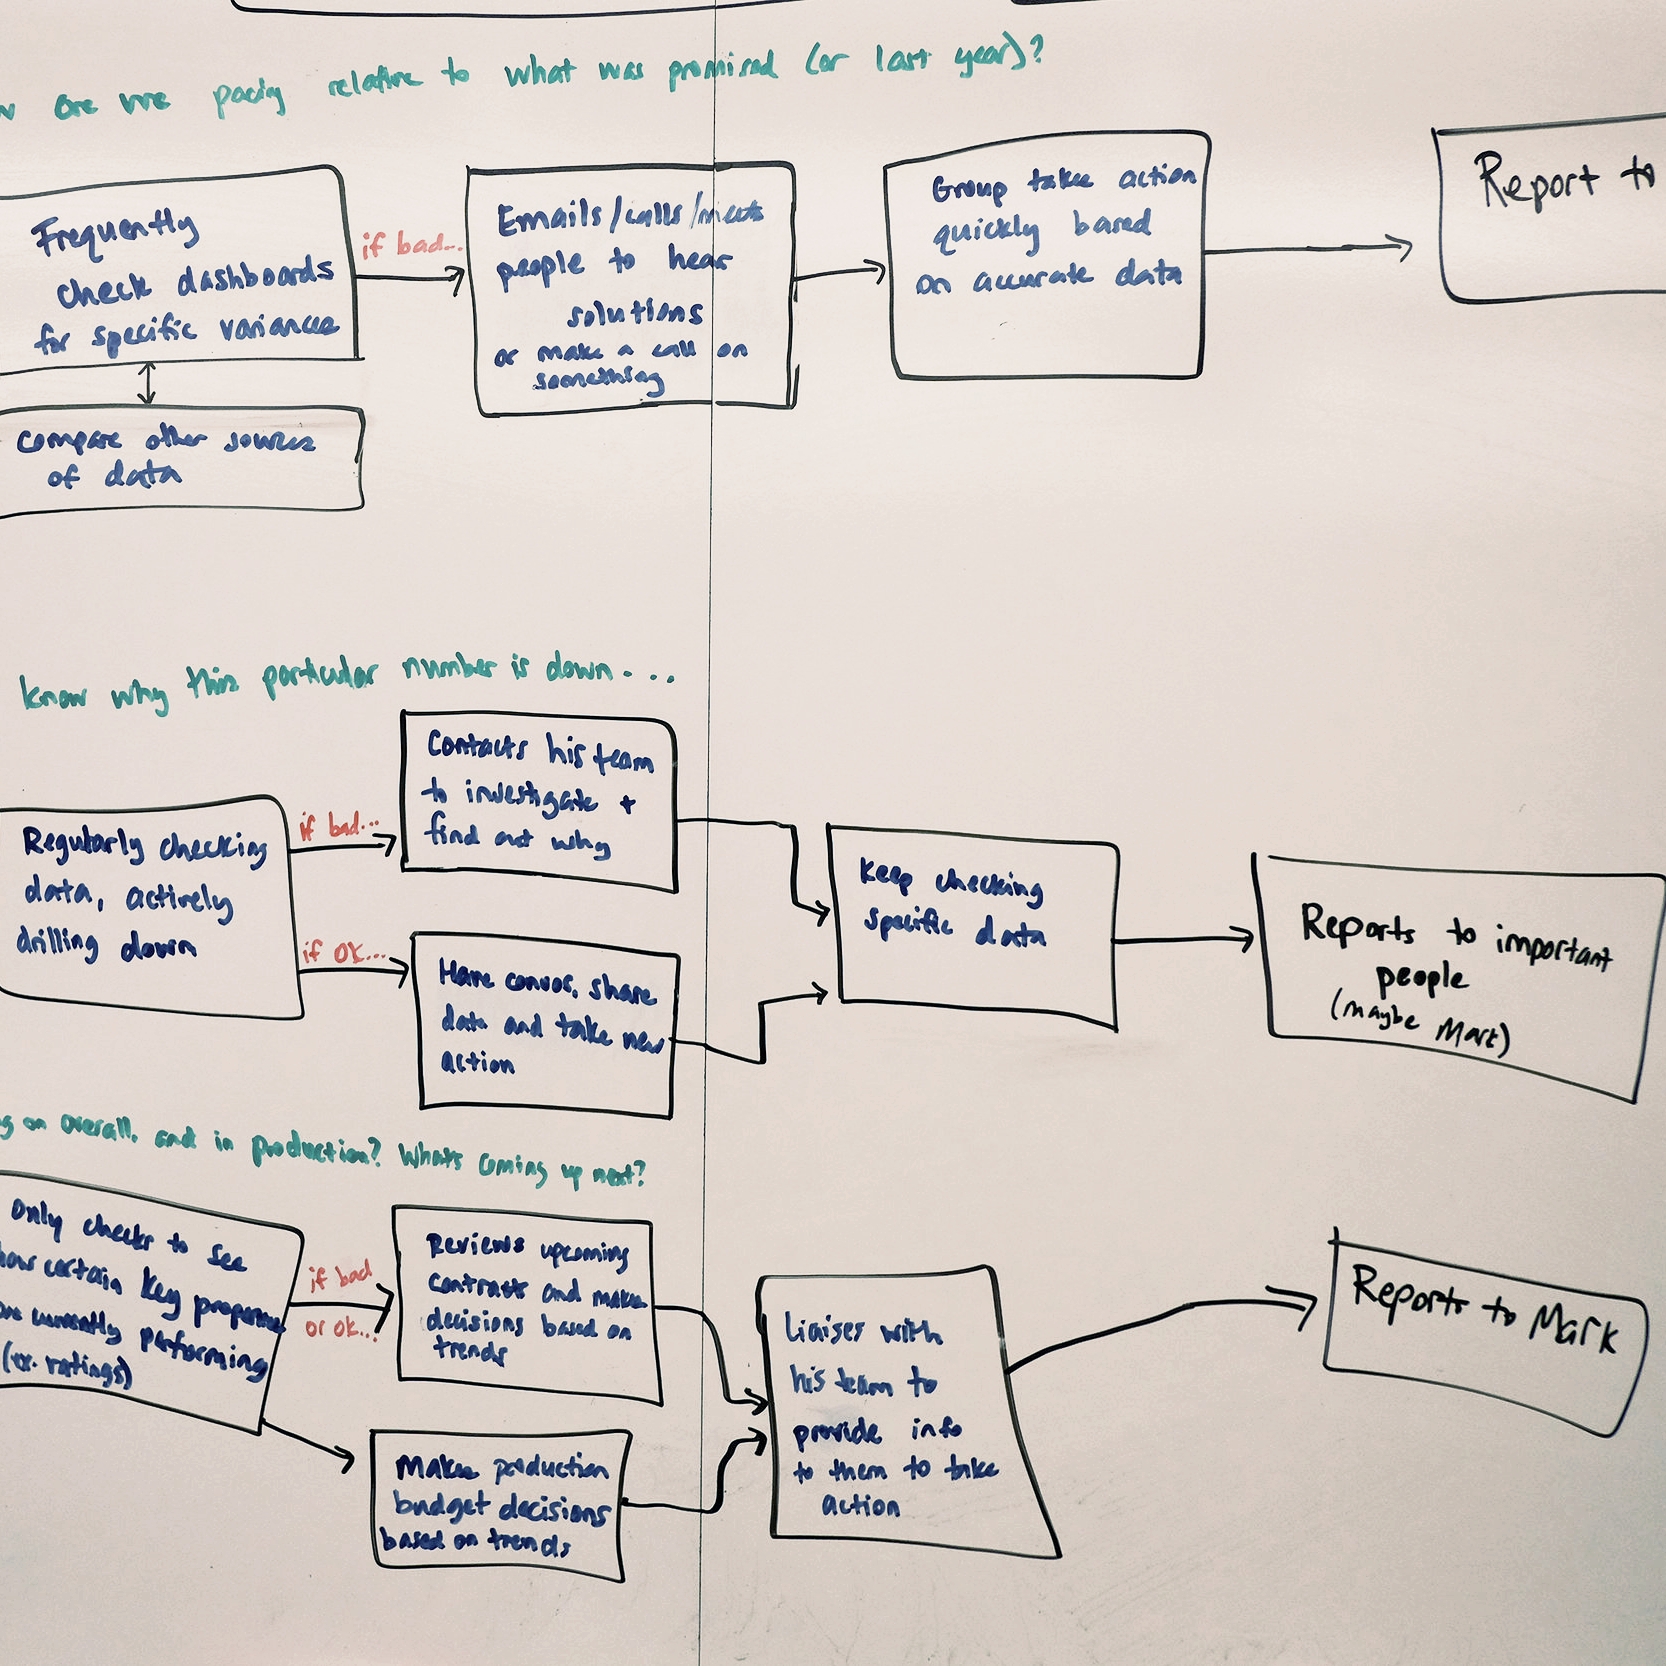
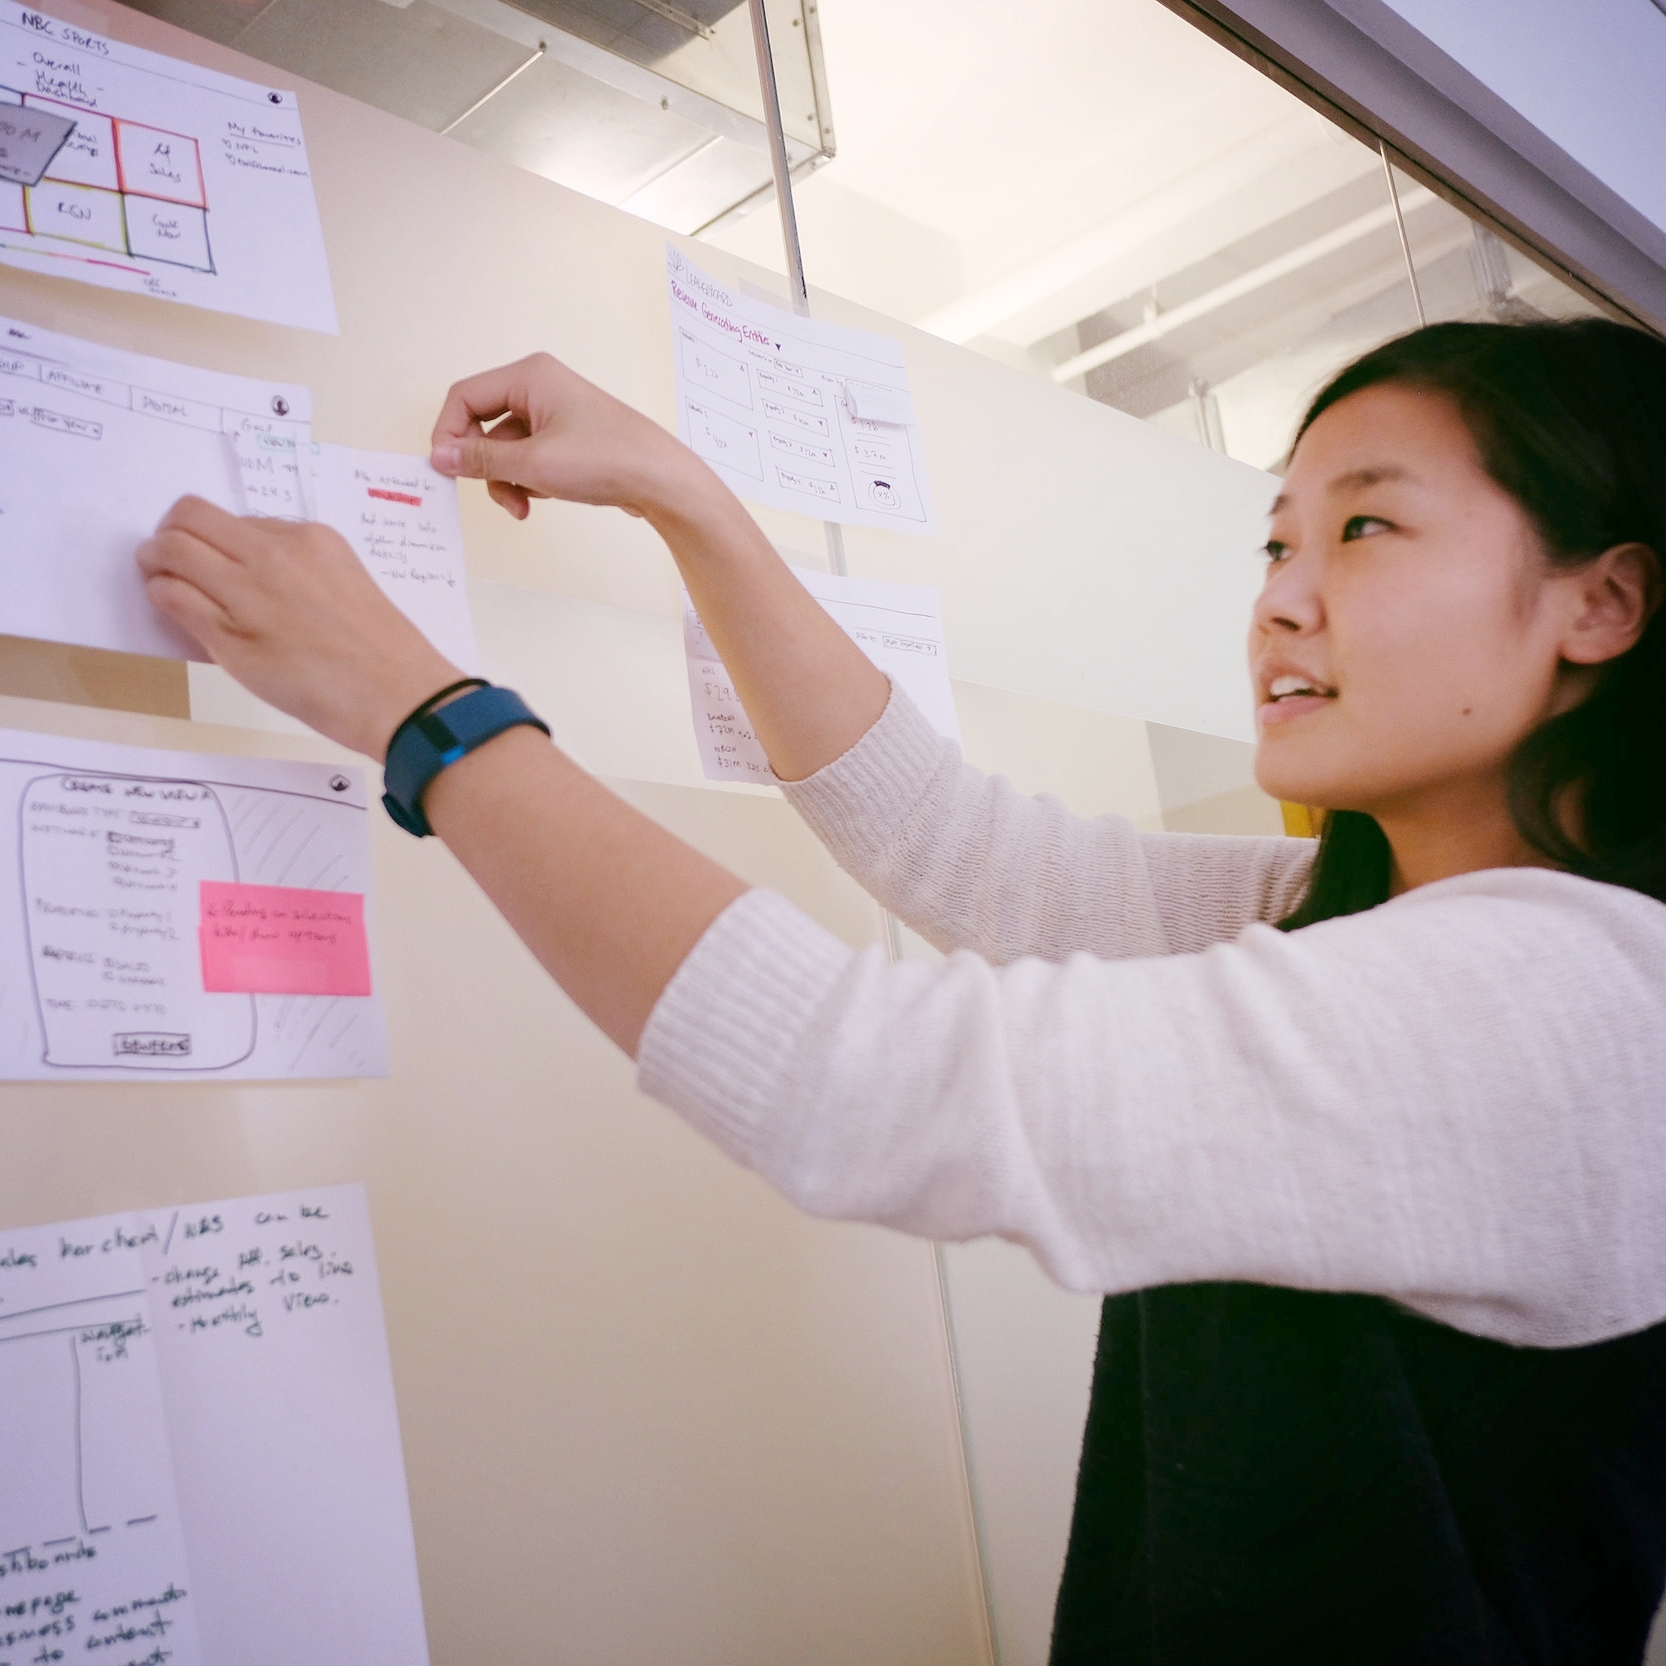
Because several weeks had already been allotted for a subsequent design and build phase in Tableau, we did not need to include time for prototyping or testing during the sprint. Cutting the sprint to three days allowed our participants to focus more on strategic goal alignment and ideation, and incorporate interactive activities led by our data visualization team. In mapping the existing user journey, we realized that rather than one user persona, there were actually three whose needs had to be considered during design. We brought subject matter experts to the table to advise on technical limitations of the platform, as well as additional resources from our Experience Design team. Sketching activities were slightly extended to focus on two main themes – navigation and dashboard design – after which many ideas were generated and voted on.
Outcome
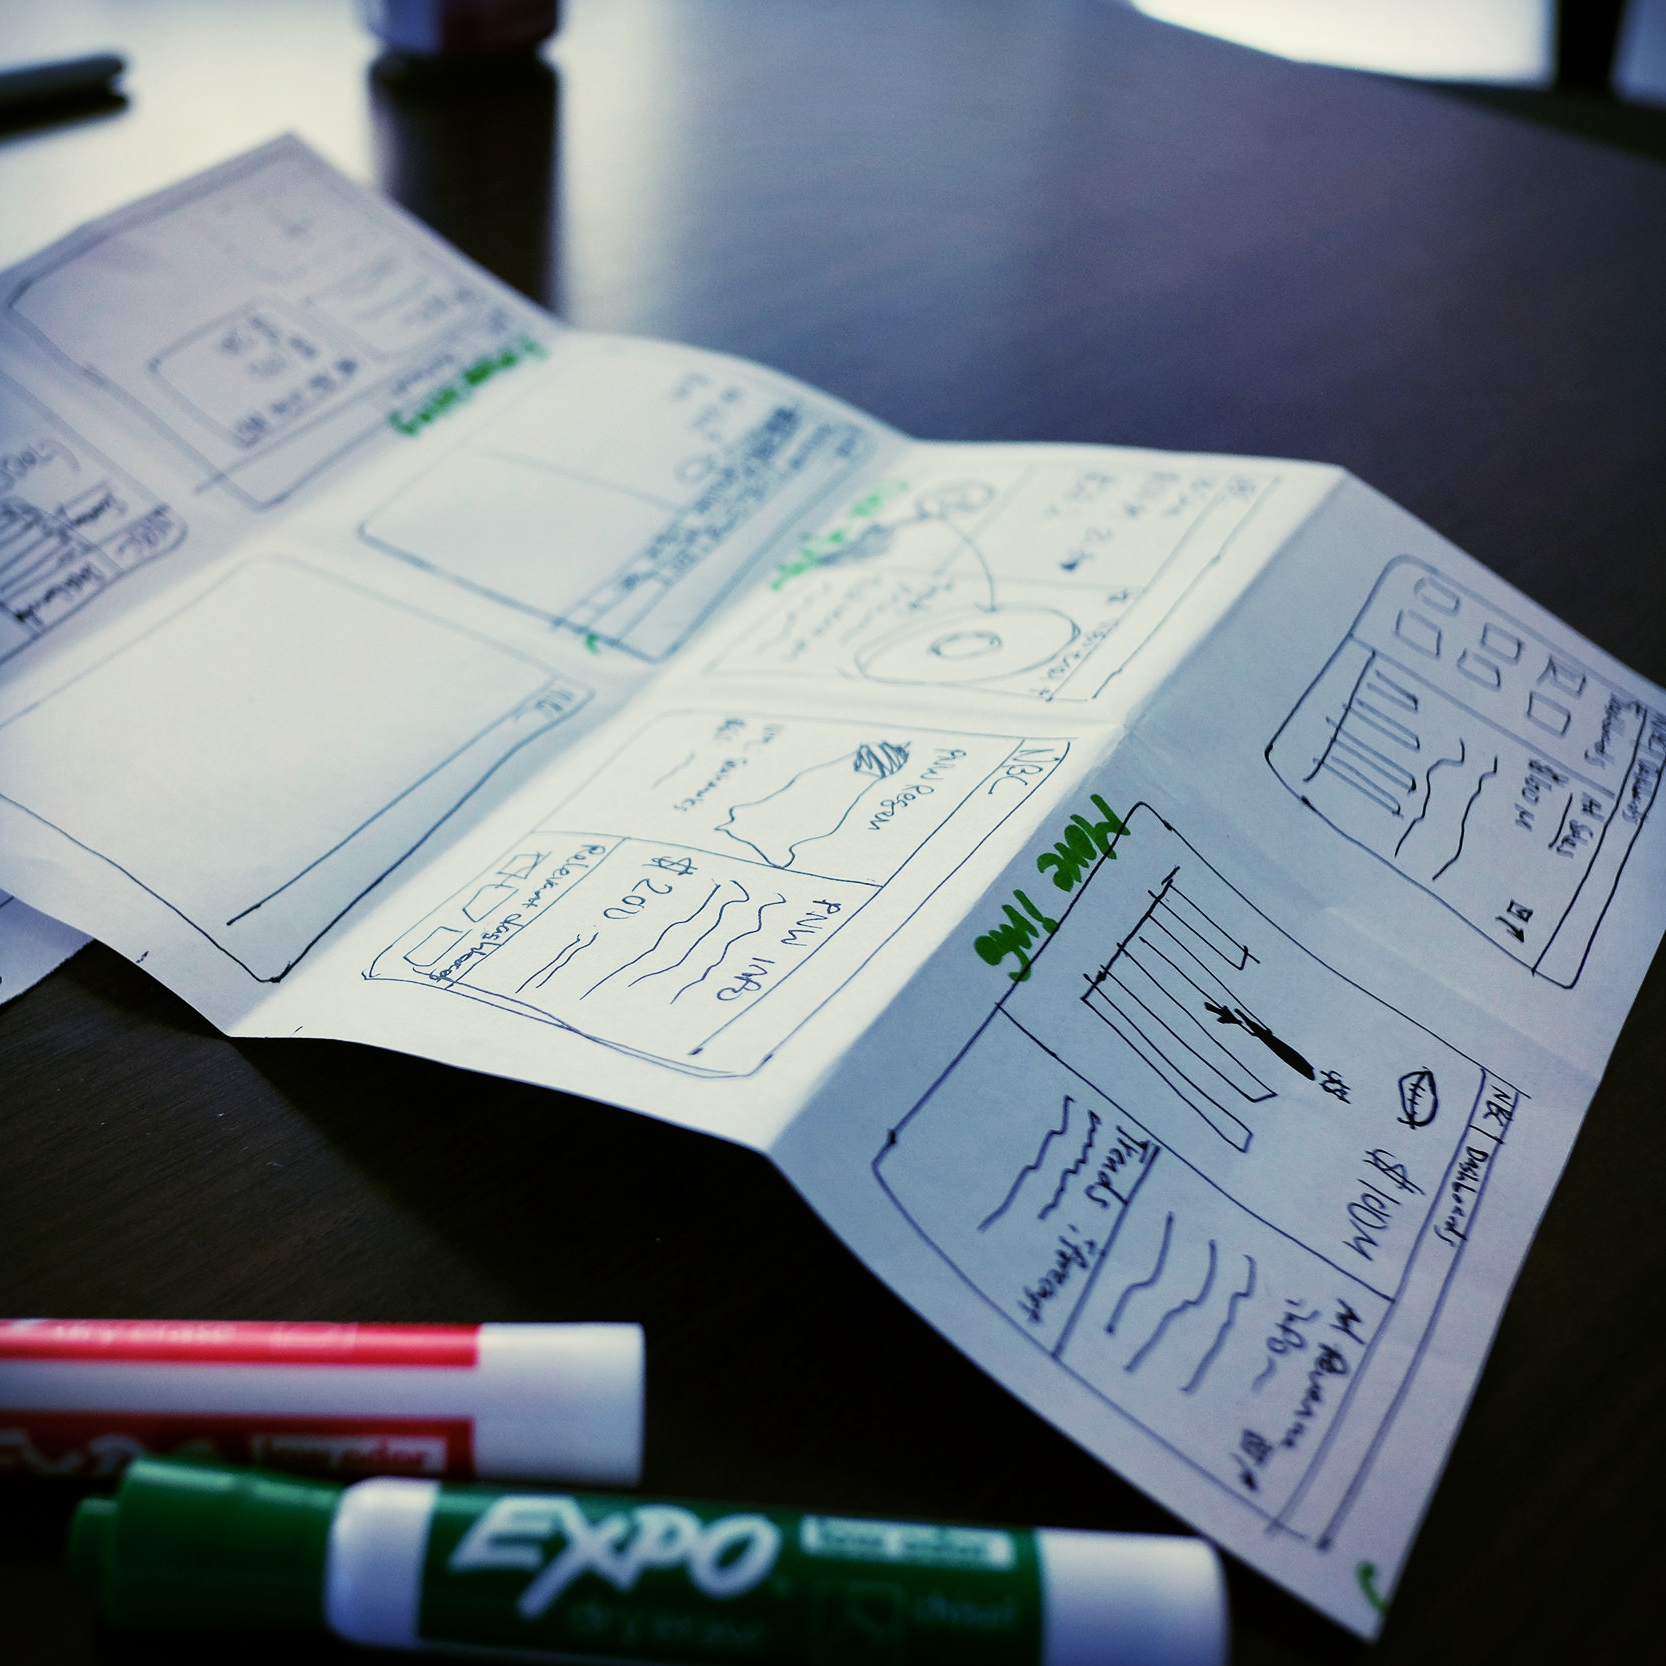
Achieving focus became a key goal, and ultimately was the most valuable part of the sprint. Designing for the "knowns" rather than the unknowns, then visualizing specific screens and interactive elements helped inform the next phase of work – defining the information architecture that would go into the new navigation designed during the sprint. A follow-up design phase allowed our team to further refine the best design ideas from sketching, while creating a visual style guide as the prototype was being created in Tableau.